GARBE PYRAMID 2022: Prime Yields of European Logistics Real Estate Declined by 7.1 Percent on Average
News 25/01/2022
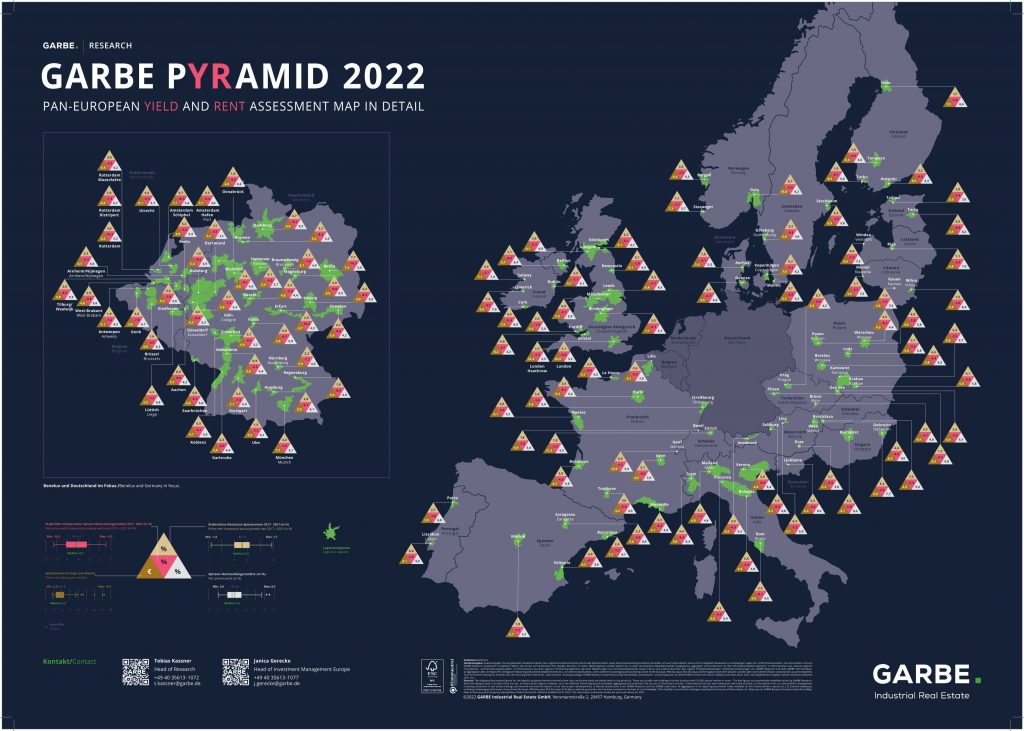
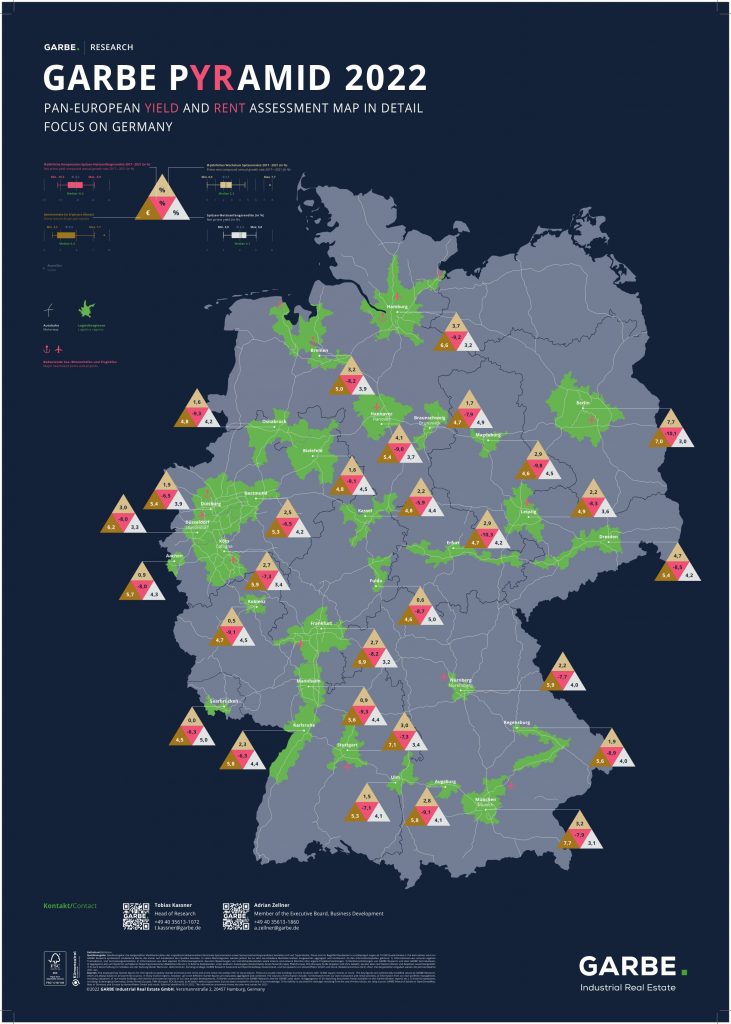
Hamburg, 25 January 2022. The prime yield of the European logistics market declined by an average of around 7.1 percent compared to prior-year period, whereas rents rose conversely by a modest 2.2 percent. These are some of the findings GARBE Research presented in GARBE PYRAMID 2022, the latest update of the company’s yield and rent map for the 122 most important submarkets for logistics real estate in Europe.
Prime net initial yields were particularly quick to harden in the Netherlands and Germany. In Rotterdam, for instance, they dropped from 4.0 to 3.3 percent within a year. This implies a change by 17.5 percent. It coincides with a rent growth by 6.9 percent during the same period of time, with rents rising from 5.80 to 6.20 euros/square metre. Much the same can be said for Amsterdam and Venlo as well as for Berlin, Bremen and Frankfurt (see table). Jan Dietrich Hempel, Managing Director of GARBE Industrial Real Estate, elaborated: “In addition to Germany, the Netherlands are another highly sought-after logistics market with a dynamic yield performance. Aside from the metropolises, cities near transport nodes with direct access to ports, airports and motorways count among the most attractive investment locations. What makes the logistics market a plausible proposition in general is not only its high yield and the evolving dynamic, but above all its long-term stability and its superior performance when compared to other asset classes. This ensures that returns remain robust in the long run despite hardening prime yields.”
No less than four Dutch cities are among the top ten cities in terms of rental uplift, these being Eindhoven (+8.3 percent), Utrecht (+7.0 percent), Rotterdam (+6.9 percent) and Venlo (+6.5 percent). Yields here declined by 5.0 to 17.5 percent. The star performer in terms of rental growth is Prague (12.2 percent). The prime rent in the Czech capital increased from 4.90 to 5.50 euros/square metre. At the same time, yields dropped by 10.6 percent, from 4.7 to 4.2 percent. For more data, see the table.
“The permanently strong demand for space coincides with a steadily dwindling supply across Europe, which fuels the rent performance. Going forward, the situation could be exacerbated by emerging or persistent trends toward re-/nearshoring, stock holding and the unchecked growth of e-commerce. Increasingly in focus now are secondary markets, and demand for them is stronger than ever: Rents here have soared more than anywhere else during the past five years,” elaborated Tobias Kassner, Head of Research at GARBE Industrial Real Estate.
For more stats and for details on methodology, please see the GARBE PYRAMID for Europe and Germany. The data referenced in our press release are sourced from the PYRAMID project. The survey focus here is on geographic breadth. This means that GARBE’s goal is to analyse as many markets and submarkets as possible.
GARBE PYRAMID: TOP 15 Europe prime rent and yield compression
| TOP 15 Europe prime rent | Prime rent in EUR/sqm per month | Change since Q4 2020, in % |
||
| Country | Region/city | Q4 2020 | Q4 2021 | |
| Czech Republic | Prague | 4.9 | 5.5 | 12.2 |
| Italy | Bologna | 4.2 | 4.6 | 9.5 |
| Germany | Magdeburg | 4.2 | 4.6 | 9.5 |
| Netherlands | Eindhoven | 4.8 | 5.2 | 8.3 |
| United Kingdom | Bristol | 7.6 | 8.2 | 7.9 |
| Netherlands | Utrecht | 5.7 | 6.1 | 7.0 |
| Netherlands | Rotterdam | 5.8 | 6.2 | 6.9 |
| Netherlands | Venlo | 4.6 | 4.9 | 6.5 |
| Germany | Berlin | 6.6 | 7.0 | 6.1 |
| France | Paris | 5.0 | 5.3 | 6.0 |
| Italy | Piacenza | 3.7 | 3.9 | 5.4 |
| Austria | Vienna | 6.0 | 6.3 | 5.0 |
| France | Lyon | 4.2 | 4.4 | 4.8 |
| Czech Republic | Pilsen | 4.3 | 4.5 | 4.7 |
| Lithuania | Kaunas | 4.3 | 4.5 | 4.7 |
Source: GARBE PYRAMID 2022
| TOP 15 Europe yield compression | Prime net initial yield, in % | Change since in % |
||
| Country | Region/city | Q4 2020 | Q4 2021 | Q4 2020 |
| Netherlands | Rotterdam | 4.0 | 3.3 | -17.5 |
| Italy | Turin | 6.4 | 5.4 | -15.6 |
| Poland | Warsaw | 5.2 | 4.4 | -15.4 |
| Netherlands | Amsterdam / Schiphol | 4.0 | 3.4 | -15.0 |
| Germany | Berlin | 3.5 | 3.0 | -14.3 |
| Netherlands | West-Brabant | 4.2 | 3.6 | -14.3 |
| Finland | Helsinki | 5.0 | 4.3 | -14.0 |
| Germany | Frankfurt | 3.7 | 3.2 | -13.5 |
| Germany | Bremen | 4.5 | 3.9 | -13.3 |
| Netherlands | Amsterdam port | 4.6 | 4.0 | -13.0 |
| Netherlands | Venlo | 3.9 | 3.4 | -12.8 |
| Ireland | Dublin | 4.7 | 4.1 | -12.8 |
| Austria | Linz | 6.3 | 5.5 | -12.7 |
| Netherlands | Rotterdam Distriport | 4.2 | 3.7 | -11.9 |
| United Kingdom | Birmingham | 4.2 | 3.7 | -11.9 |
Source: GARBE PYRAMID 2022

